Tips
This chapter will be used to record tips during the usage of Prometheus.
Import Community Defined Grafana Dashboard
Grafana is powerful allowing end users define dashboards based on their requirements. However, this does not mean we have to define our dashboards from scratch all the time (or import dashboards we ourselves previously defined). Actually, we can import dashboards defined by the community easily.
Here is an example how to import a community defined dashboard:
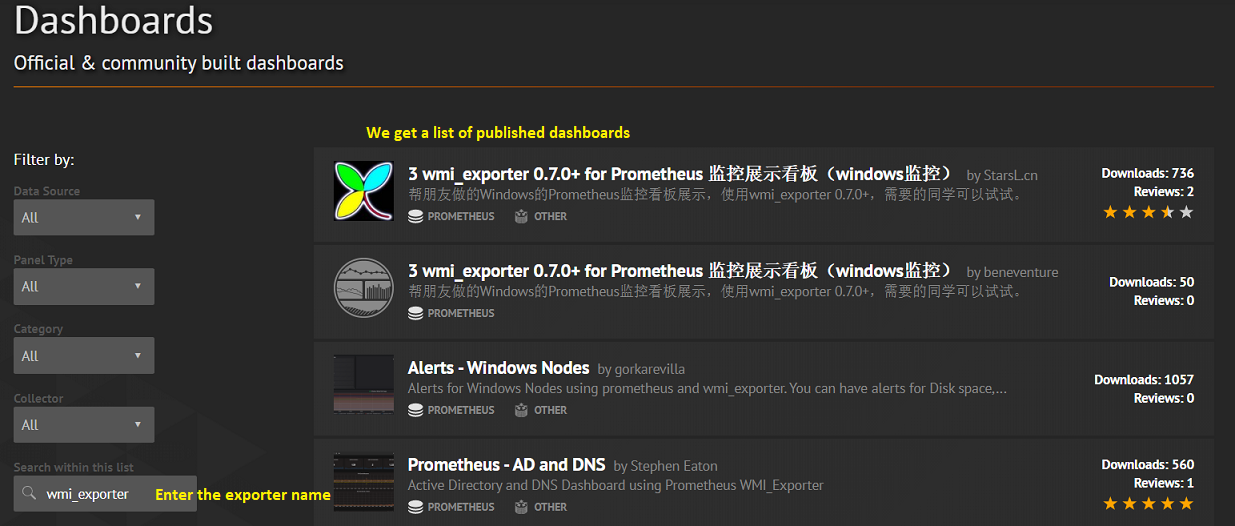
Find available dashabords published by the community here;
E.g., we want to create a dashboard for the wmi_exporter:
Click the first dashboard which is the most popular one and we can see its description together with a dashboard ID:
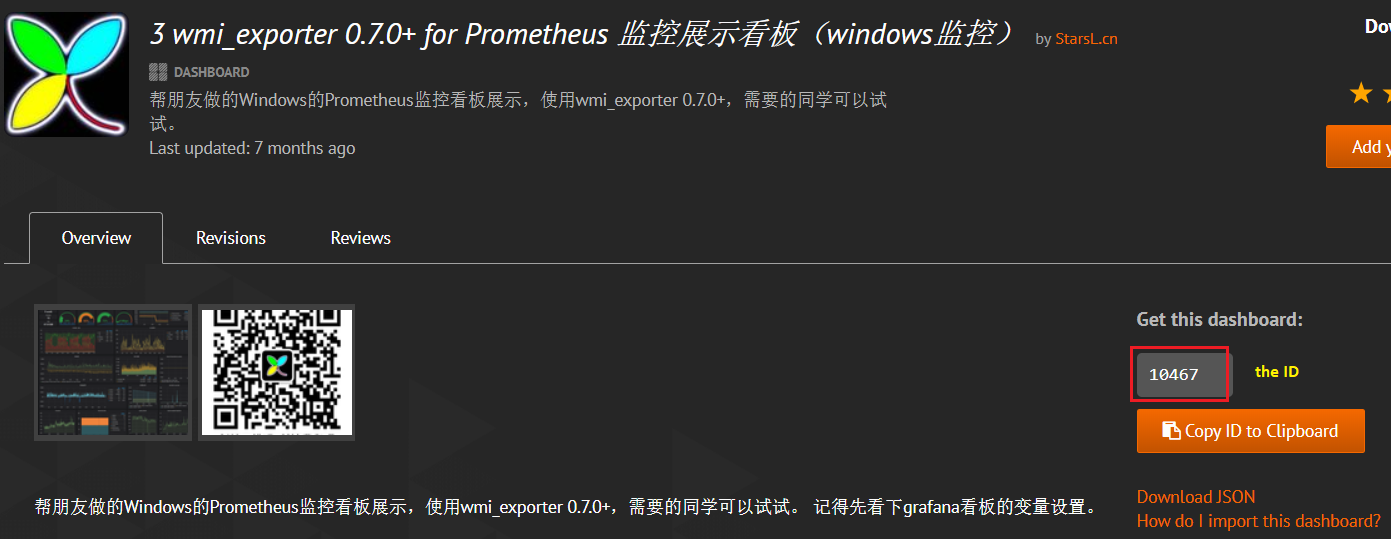
Copy the dashboard ID, then go to our dashboard GUI: Create->Import->Paste the dashboard ID->Wait for a while->Name it and select the Prometheus data souce->Import;
We have a working dashboard now:
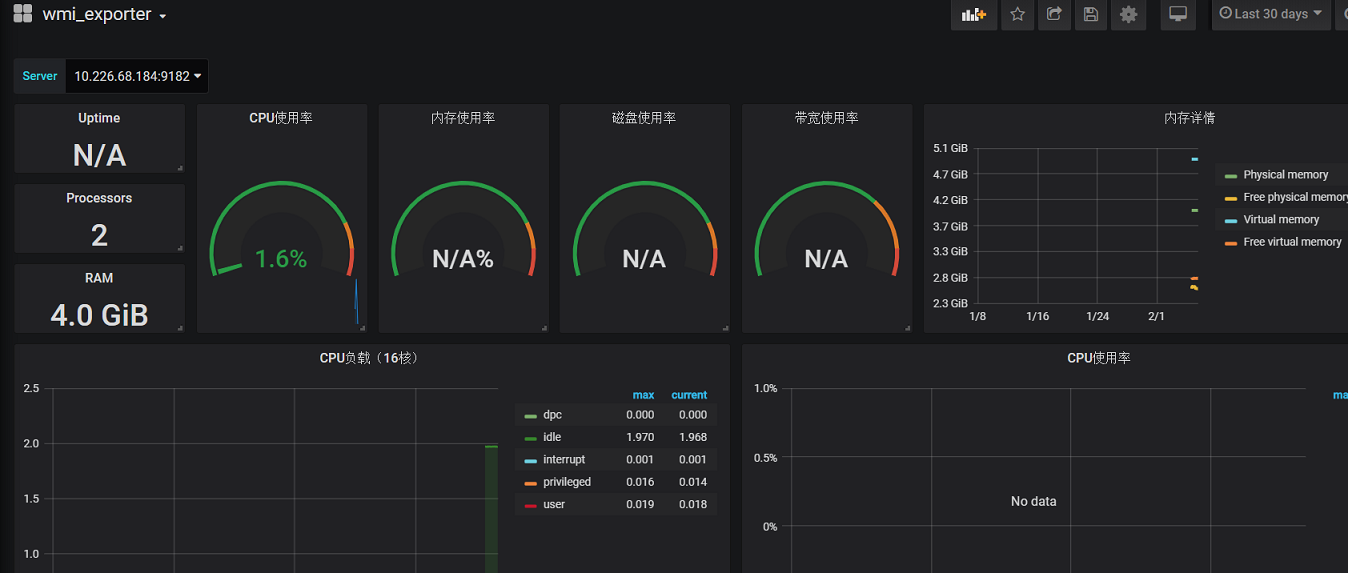
If the dashboard does not meet your requirements, modify it!
Done!