Overview
Performance monitoring (and alerts management) is one key focus of IT operations. There exist several good solutions, such as Zabbix, Nagios, etc.
Prometheus is the most popular solution recent years for the same target since it supports Kubernetes monitoring which makes it the best choice for monitoring cloud native solutions when cloud becomes the trend of IT. However, its popularity is not simply because of the rapid adoption of Kubernetes. Prometheus is designed with smart architecture, great API for extension, wonderful features for scaling, etc. All these advantages make Prometheus suitable for almost all kinds of monitoring requirements in data centers.
The Ecosystem
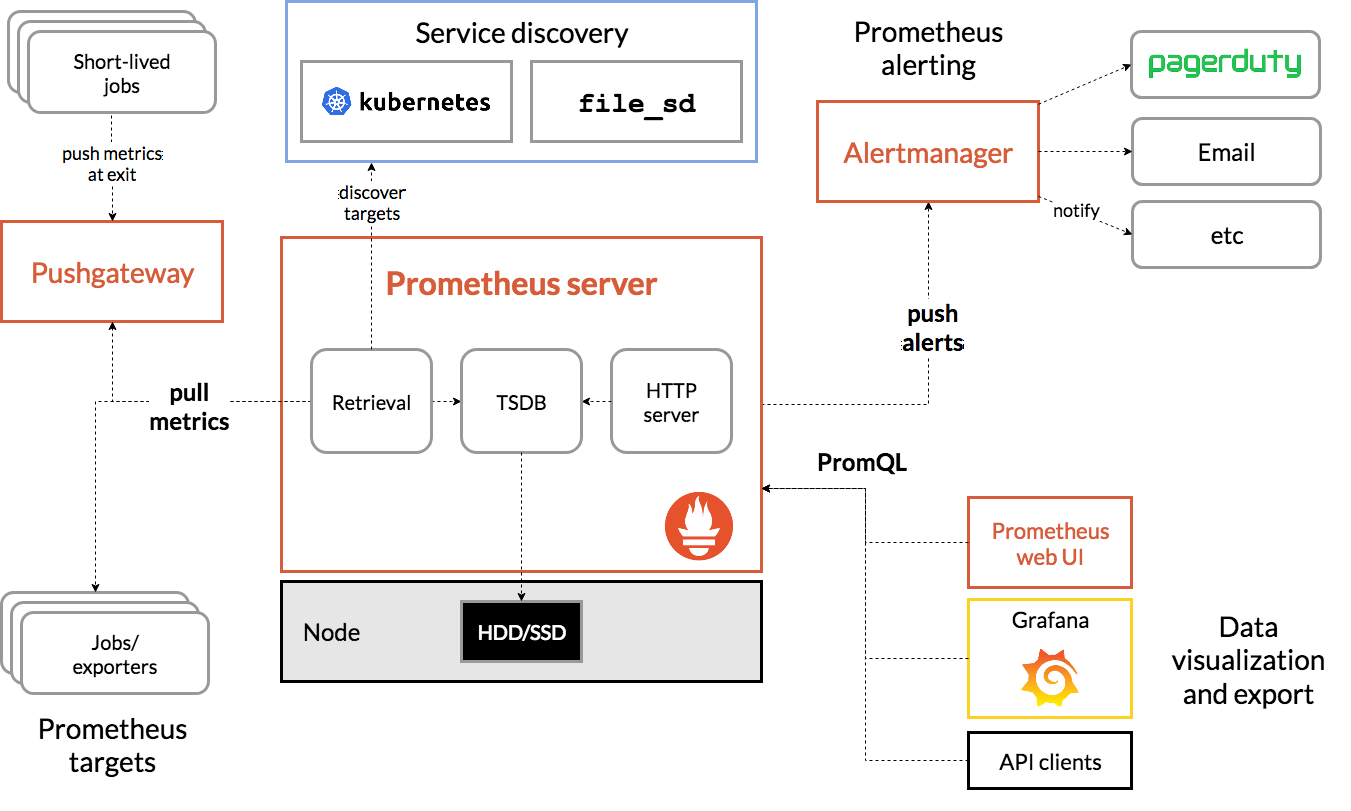
When we talk about Prometheus, actually we are talking about an ecosystem for performance monitoring around Prometheus but not just itself. The ecosystem consists of several major components:
- Prometheus Server: scrapes and stores time series data;
- Exporters: collect metrics from data sources, like Linux, Windows, network equipement, databases, etc.;
- Pushgateway: allows ephemeral and batch jobs to expose their metrics to Prometheus;
- Grafana: displays metrics through a powerful web based GUI;
- Alertmanager: handles alerts.
All these components work closely to achieve the monitoring goals with a data flow as below:
- Prometheus exporters are responsible for collecting performance metrics from targets (monitored devices). They work as standalone apps running close to or even on the targets. The Prometheus company or users can implement their own exporters based on their requirements. There exist quite a few exporters for use directly, refer here;
- When the monitoring targets are ephemeral jobs, it is not worthwhile running an exporter for ever. Under such a condition, metrics can be collected through whatever implementations (shell, ruby, python, java, etc. as long as the output follows the required format) and pushed to Pushgateway;
- Prometheus itself does not collect metrics from targets directly, instead, it collects (called scrape by Prometheus) metrics from enabled exporters and Pushgateway and save metric data locally into the ./data directly or remotely to a database (such as InfluxDB);
- Grafana leverages Prometheus as a data source through PromQL (Prometheus query language) and showcases metrics based on user defined dashboards;
- Alertmanager works by defining rules related with specified metrics on Prometheus server and get alerted when the metrics exceed defined thresholds.
Further Clarifications
Prometheus is a matured monitoring solution suitable for most IT cases, for more information about it, please refer to the official overview.
Before moving forward to the next chapter, there are some more clarifications about the relationshipts on exporter, Prometheus, and Grafana you should always be clear about:
- Exporters only collect metrics from targets, they won’t save metrics;
- Prometheus scraps metrics from exporters and save the metrics centraly. Advanced queries against the metrics are supported by Prometheus through PromQL;
- Grafana leverages PromQL and its builtin query functions to filter metrics and display them on dashboards;
- Grafana uses Prometheus as a kind of data source, and also support quite a lot other data sources such as ELK, InfluxDB, etc.