Tips
This chapter will be used to record tips during the usage of Prometheus.
Install Prometheus as a Systemd Service
Configuring a systemd service to control prometheus running is much handy than running it from the CLI as an executable binary. This tip shares the common steps to create a systemd service for Prometheus.
sudo useradd --no-create-home --shell /bin/false prometheus

tar -zxvf prometheus-xxxxxx.linux-amd64.tar.gz
sudo mv prometheus-xxxxxx.linux-amd64 /opt/prometheus
sudo mkdir /opt/prometheus/data
sudo chown -R prometheus:prometheus /opt/prometheus

sudo mkdir /etc/prometheus
sudo cp /opt/prometheus/prometheus.yml /etc/prometheus
sudo chown -R prometheus:prometheus /etc/prometheus

sudo cat > /etc/systemd/system/prometheus.service <<-EOF
[Unit]
Description=Prometheus
Wants=network-online.target
After=network-online.target

[Service]
User=prometheus
Group=prometheus
Type=simple
Restart=on-failure
ExecStart=/opt/prometheus/prometheus \
--config.file /etc/prometheus/prometheus.yml \
--storage.tsdb.path /opt/prometheus/data \
--storage.tsdb.retention.time 15d

[Install]
WantedBy=multi-user.target
EOF

sudo systemctl daemon-reload
sudo systemctl start prometheus
Import Community Defined Grafana Dashboard
Grafana is powerful allowing end users define dashboards based on their requirements. However, this does not mean we have to define our dashboards from scratch all the time (or import dashboards we ourselves previously defined). Actually, we can import dashboards defined by the community easily.
Here is an example how to import a community defined dashboard:
Find available dashboards published by the community here;
E.g., we want to create a dashboard for the wmi_exporter:
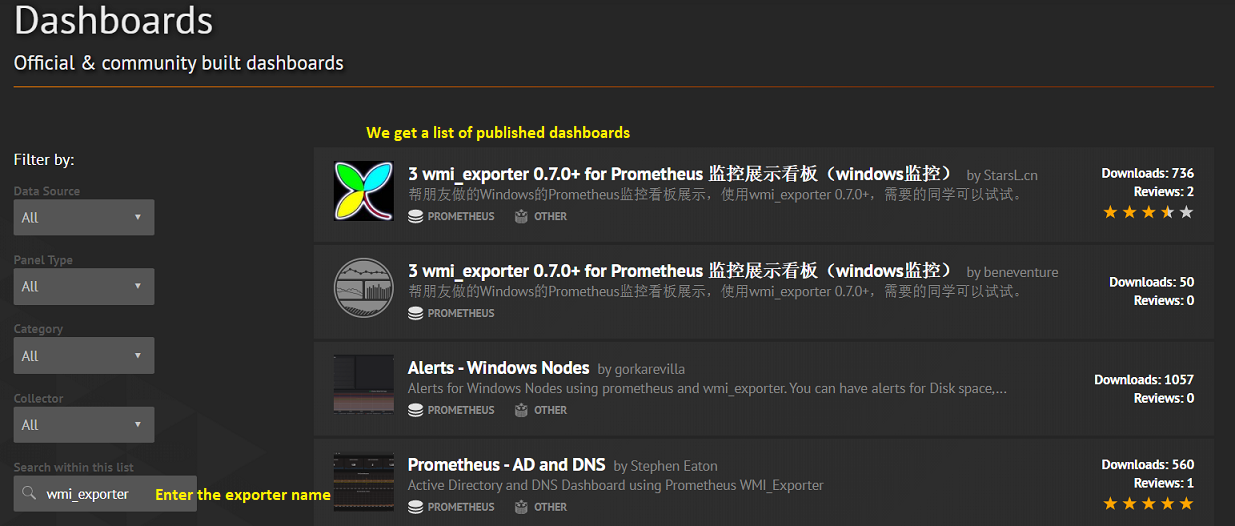
Click the first dashboard which is the most popular one and we can see its description together with a dashboard ID:
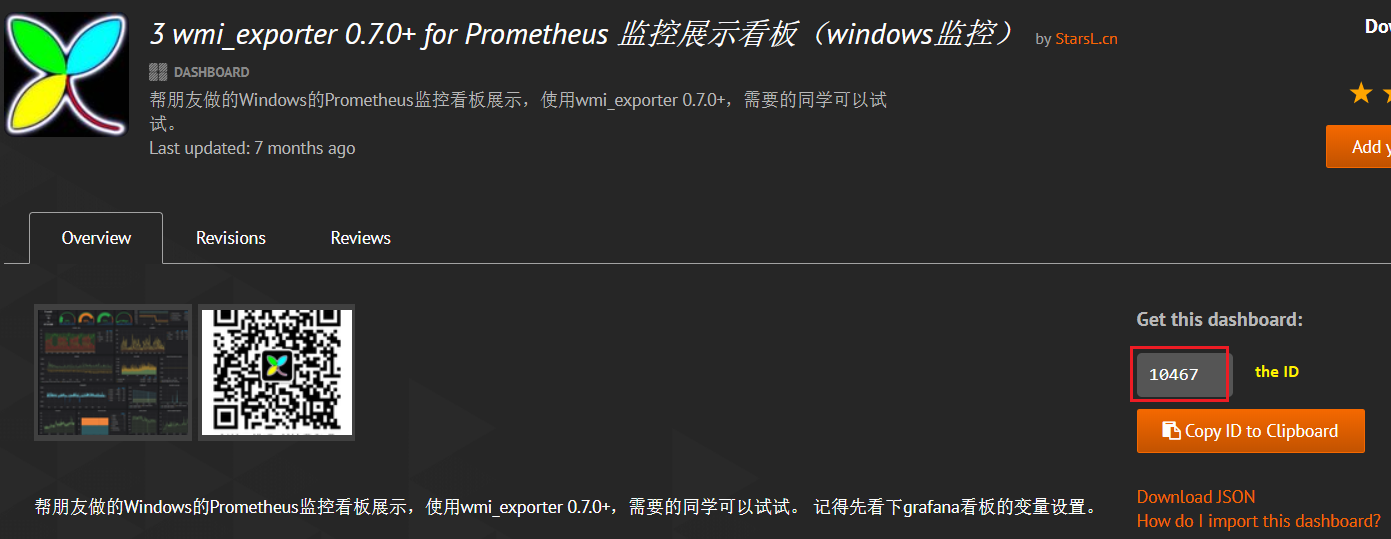
Copy the dashboard ID, then go to our dashboard GUI: Create->Import->Paste the dashboard ID->Wait for a while->Name it and select the Prometheus data source->Import;
We have a working dashboard now:
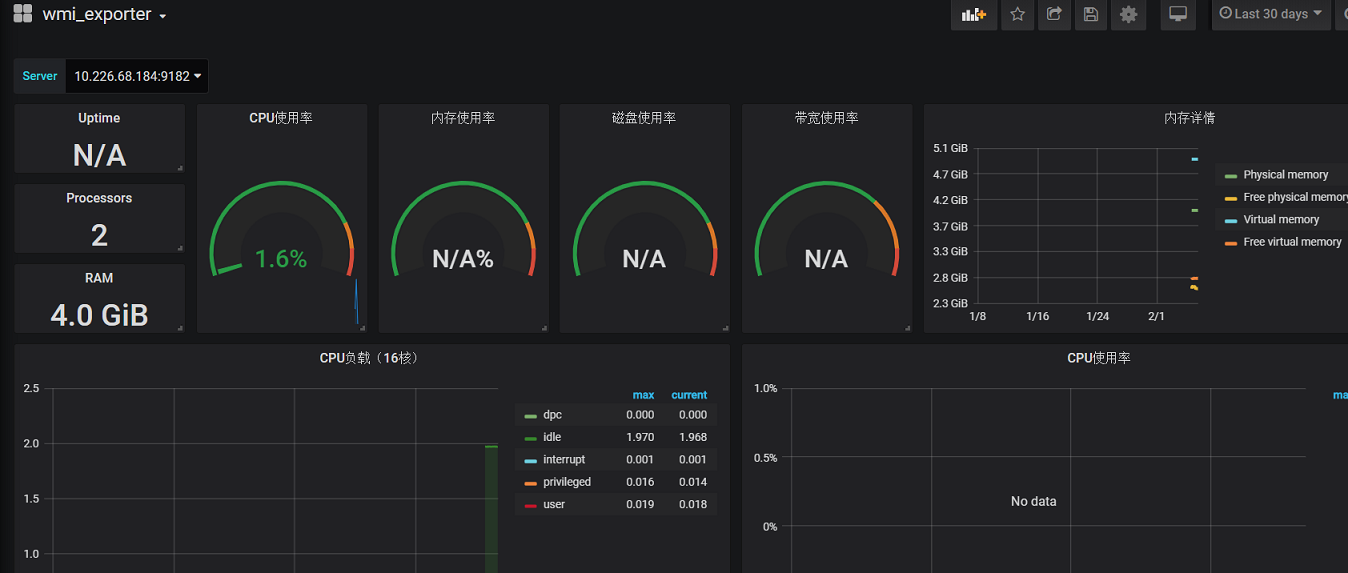
If the dashboard does not meet your requirements, modify it!
Done!
Add New Labels
This tip shows 2 x methods to add labels.
The original configuration: label “node_type” is added to both targets with the same value.
- job_name: 'node_exporter'
  static_configs:
    - targets:
        - '192.168.10.10:9100'
        - '192.168.10.11:9100'
      labels:
        node_type: 'unity_node'
Add different labels by splitting targets:
- job_name: 'node_exporter'
  static_configs:
    - targets:
        - '192.168.10.10:9100'
      labels:
        node_type: 'unity_node'
        node: node1
    - targets:
        - '192.168.10.11:9100'
      labels:
        node_type: 'unity_node'
        node: node2
Add different labels by using relabel_configs:
- job_name: 'node_exporter'
  static_configs:
    - targets:
        - '192.168.10.10:9100'
        - '192.168.10.11:9100'
      labels:
        node_type: 'unity_node'
  relabel_configs:
    - source_labels: [__address__]
      regex: '.+?\.10:9100'
      target_label: 'node'
      replacement: 'node1'
    - source_labels: [__address__]
      regex: '.+?\.11:9100'
      target_label: 'node'
      replacement: 'node2'
Select Legends to Display on Grafana Panel
- Click the color icon “-” of a legend on a panel:
- Select the color to be used
- Customize the color to be used
- Align the legend to left/right Y axis
- Click the name of a legend
- Only this legend will be displayed on the panel
- Click again, all legends will be displayed as before
- Shift + Click legends: select multiple legends to display on the panel
- Ctrl + Click legends : select multiple legends to not display
Graph Top N in Grafana
PromQL topk will show more than expected results on Grafana panels because of this issue.
The problem can be worked around by defining a variable containing the top N results, then filter query results with this variable in Panel. The details can be found here.
Below is a straightforward example:
Metrics:
disk_read_average
disk_read_average{instance="192.168.10.11:9272",job="vcenter",vm_name="vm1"}
disk_read_average{instance="192.168.10.11:9272",job="vcenter",vm_name="vm2"}
...
disk_read_average{instance="192.168.10.11:9272",job="vcenter",vm_name="vm100"}
disk_write_average
disk_write_average{instance="192.168.10.11:9272",job="vcenter",vm_name="vm1"}
disk_write_average{instance="192.168.10.11:9272",job="vcenter",vm_name="vm2"}
...
disk_write_average{instance="192.168.10.11:9272",job="vcenter",vm_name="vm100"}
Goal: show disk I/O (read + write) for the top 5 x VMs
Define a variable (top_vm_io) which returns the top 5 x VMs
# Query
query_result(topk(5, avg_over_time((disk_read_average + disk_write_average)[${__range_s}s:])))
# Regex
/vm_name="(.*)"/
# Enable "Multi-value" and "Include All option"
Panel query
disk_read_average{vm_name=~"$top_vm_io"} + disk_write_average{vm_name=~"$top_vm_io"}
Notes:
Use Telegraf as Exporters
Telegraf is a part of the TICK Stack monitoring solution. Telegraf supports collecting metrics from different sources through input plugins and shipping metrics to different destinations through output plugins.
Prometheus is a supported output destination, in other words, Telegraf can be used as Prometheus exporters. It supports a large num. of input plugins, including OSs, databases, clouds, etc.
Usage:
List supported input plugins:
telegraf --input-list
List supported output plugins:
telegraf --output-list
Generate a config with vSphere input plugin and Prometheus output plugin:
telegraf --section-filter agent:inputs:outputs --input-filter vsphere --output-filter prometheus_client config | tee telegraf.conf
Run Telegraf:
# After tuning the config
telegraf --config telegraf.conf
Collect Metrics with Arbitrary Scripts
Sometimes, it is not cost effective to implement a Prometheus exporter with Go/Python. For example, to collect CPU related metrics on Linux - a shell script will do the work much easier and will take less time than implementing a Prometheus exporter.
Scripts are great, but it is a must to make their outputs both understandable and acceptable to Prometheus. Generally speaking, there are 2 x feasible ways:
- Prometheus Pushgateway: push metrics to Prometheus Pushgateway (then metrics are collected from Pushgateway by Promtehus “pull”) with any kind of scripts as long as their outputs are in line with the required format. It is recommended to be used for ephemeral and batch jobs. For more information, refer to Prometheus Pushgateway;
- Telegraf Exec Input Plugin: Telegraf gets the capability to collect metrics by running arbitrary commands/scripts periodically. Refer to Exec Input Plugin for details.
Use Alerta to Manage Alerts
Prometheus Alertmanager is a really powerful alerting management solution, however, its GUI is not suitable for daily operations. Alerta provides a great interface consolidating alerts for main monitoring solutions like Prometheus, Nagios, Zabbix, etc.
Alerta makes use of Alertmanager which sends alerts as notifications to Alerta through webhooks. The deployment is easy and straightforward, please refer to the official document for details.
Show Diagrams on Grafana Panel
It is smart to show the relationships of monitored targets. A plugin named Diagram Panel can be used for this purpose. Below is a simple example:
Install the plugin:
pkill grafana-server
./bin/grafana-cli --pluginsDir=./data/plugins plugins install jdbranham-diagram-panel
./bin/grafana-server
Add panel->Add Query->Leave the “Queries” tab as default (empty);
Visualization->Diagram;
Define a diagram with mermaid syntax:
- Refer to Mermaid Flowcharts Syntax for syntax details;
- Use Mermaid Live Editor to define the chart;
- Copy the chart code (Mermaid markdown) and paste it to the panel;
Done.
The Built-in “up” Metric
up is a built-in Prometheus metric. Each instance has a “up” metric indicates:
- 1: the instance is healthy
- 0: the instance can not be scraped
It can be used to grab job and instance information while defining variables with Grafana. For more details, refer to JOBS AND INSTANCES.
Scrape Interval Pitfall
For a single job with multiple scrapping targets, the “scrape_interval” should not be set with a too large value (the exact maximum value needs to be determined by careful tunings).
The background reason needs to be clarified with an example:
# Assume a blackbox_exporter job is configured with 100 x ICMP probe targets as below:
- job_name: 'blackbox_exporter'
  scrape_interval: 60m
  metrics_path: /probe
  params:
    module: [icmp]
  static_configs:
    - targets:
        - 192.168.10.101
        - ...
        - 192.168.10.200
      labels:
        type: server
  relabel_configs:
    - source_labels: [__address__]
      target_label: __param_target
    - source_labels: [__param_target]
      target_label: instance
    - target_label: __address__
      replacement: blacbox1.lab1.local:9115
    - source_labels: [__address__]
      target_label: exporter
This configure works, however, PromQL (such as “probe_success” for blackbox_exporter) won’t return 100 x success/fail results as expected. The reason is that the “scrape_interval” is 60 minutes, which means the job can take its time to compete the full scraping within this big time window. However, PromQL instant query only returns values which fall in a small time window comparing with the current timestamp (several minutes, may be related with PromQL resultion and step???) - although all targets have been scraped, but their results are distributed within the big time window (1 x hour in this example). When a query is run, some scraping results are far from the current timestamp and won’t be included within the query results.
Because of the reason just mentioned as above, the scrape interval should not be set with a huge value. The exact maximum needs to be determined by tuning the scrape interval and run PromQL accordingly until the expected behavior is gotten.
Reload Prometheus through HTTP POST
Prometheus can reload its configuration file after getting a HUP signal. In the meanwhile, the same behavior can be triggered by sending as HTTP POST as below:
# Prometheus must be started with option "--web.enable-lifecycle"
curl -X POST http://<IP>:9090/-/reload
Add a Label with PromQL
PromQL can be used to add a label on the fly. This is useful for the “Outer join” transformation - make sure the fields (columns) with the same names can be referred to by different names. Refer to Duplicate column names in table panel for the background.
# The original metric
accessible{host="10.226.68.185",instance="192.168.56.10:9091",job="pushgateway",type="linux"}

# PromQL
label_replace(accessible, "type1", "$1","type", "(.*)" )

# The result
accessible{host="10.226.68.185",instance="192.168.56.10:9091",job="pushgateway",type="linux", type1="linux"}